Crypto Academy
introduction
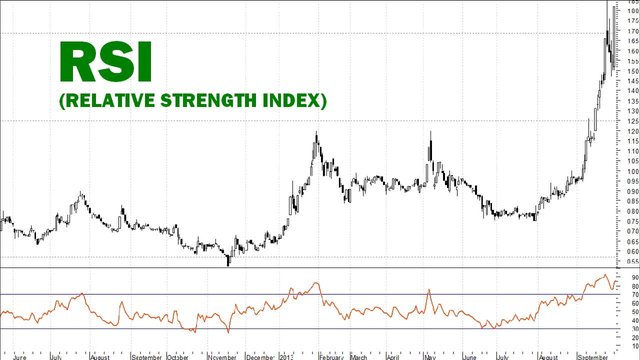
What is the Relative Strength Index - RSI and how is it calculated?
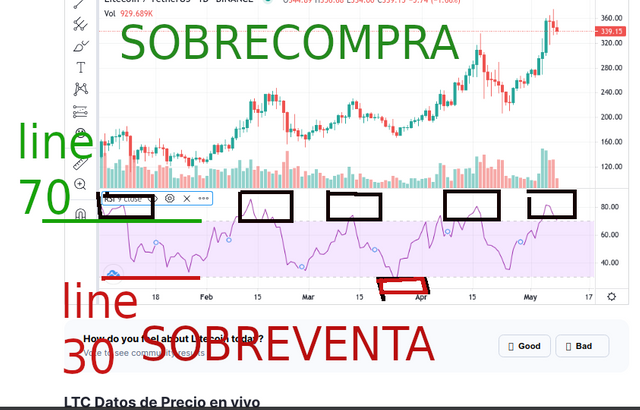
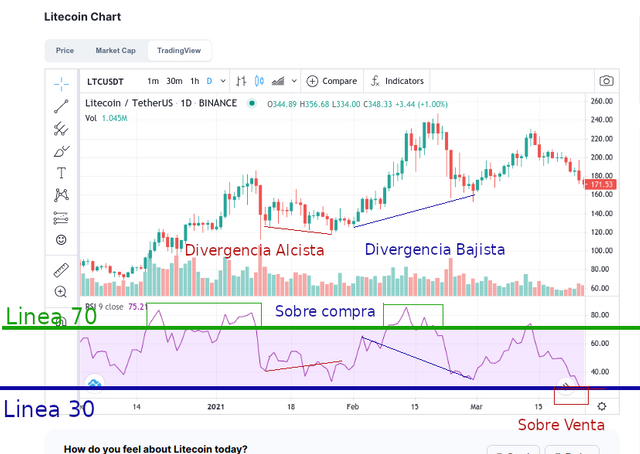
The RSI is an indicator in the form of a graph that serves to measure overbought and oversold this indicator goes from 0 to 100 with 70 being the mark to indicate overbought and less than 30 for overselling this system was created in the late 70s and The beginning of the 80s and despite the technological advances that we have gone through, it is still used in these times this indicator uses cycles of 14 to be able to accurately measure the market trend
the average gain between the average loss then divide the gains with the losses and the relative average is obtained, RSI index to be able to get the RSI is the same as 100 - 100 / (1 + rs) the rs is the relative resistance and this indicator is seen on a graph that goes from 0 to 100
Can we trust the RSI in cryptocurrency trading and why?
How is the RSI indicator set on the chart and what does the length parameter mean?
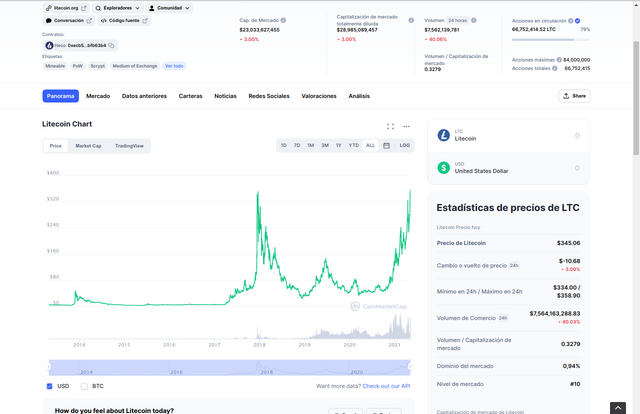
1 enter the coinmarketcap page and look for the pair of our choice
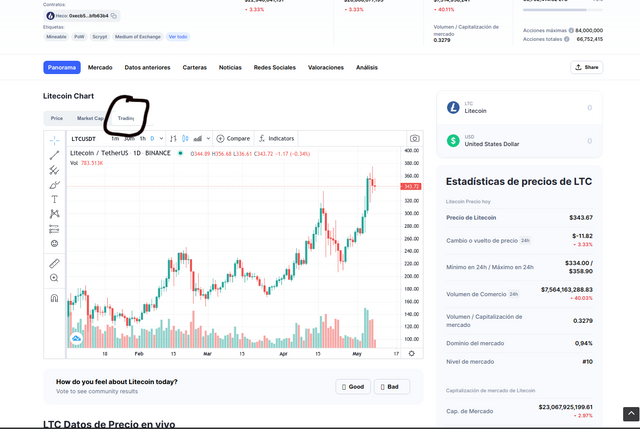
2 proceed to click on the word TraidigView
after having pressed we will click on fx indicators
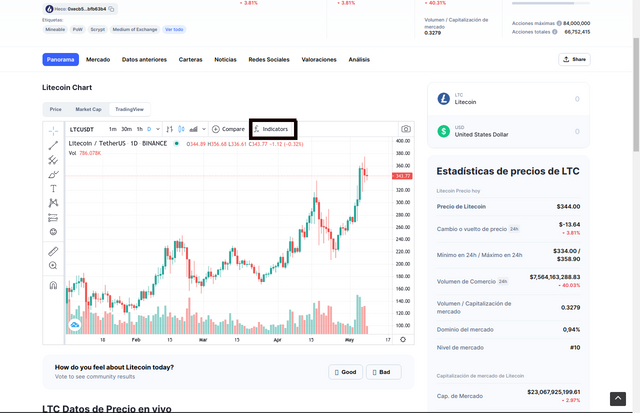
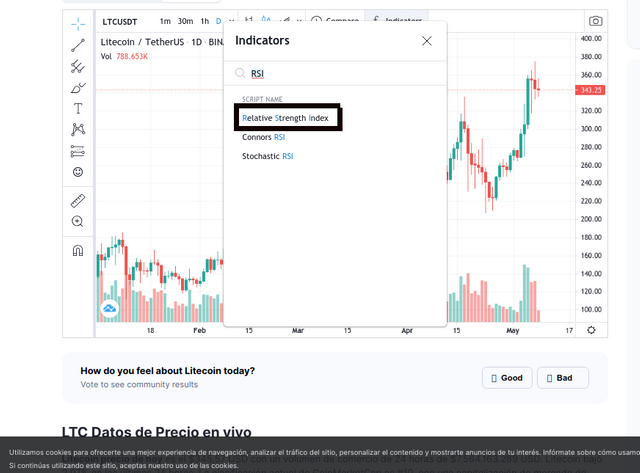
then a search menu will appear in which we will place the name of our RSI indicator once the results appear we will indicate that we want to observe the relative strength index
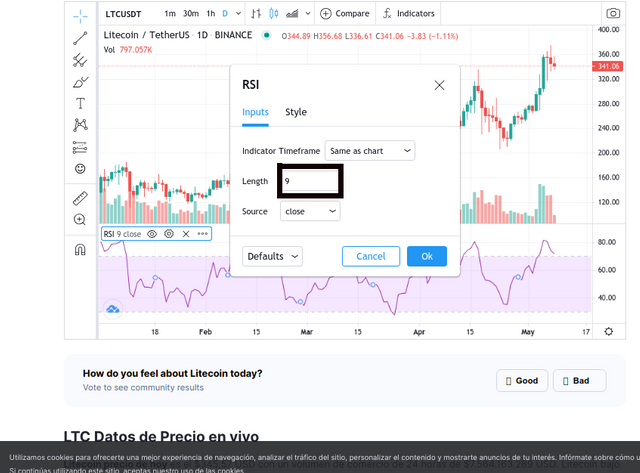
After the search engine shows you the result you will go to the configuration button in which a menu will appear in which you can change the length of the RSI
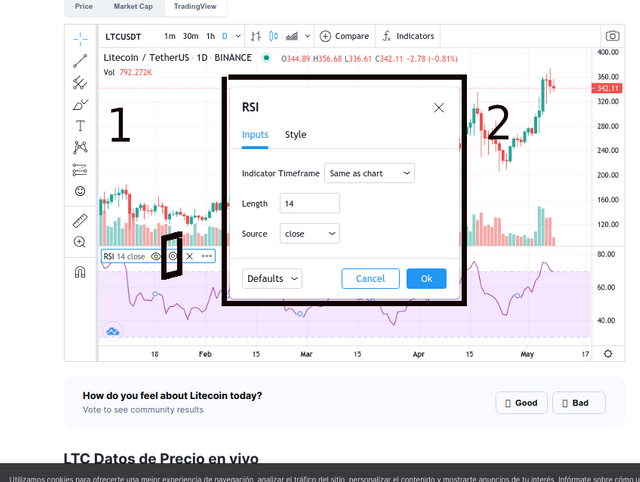
Why is it equal to 14 by default?
Can we change it? (Screenshot required)
How do you interpret overbought and oversold signals when trading cryptocurrencies? (Screenshot required)
How do we filter RSI signals to distinguish and recognize true signals from false signals? (Screenshot required)
one identifies these signals thanks to bullish and bearish divergences
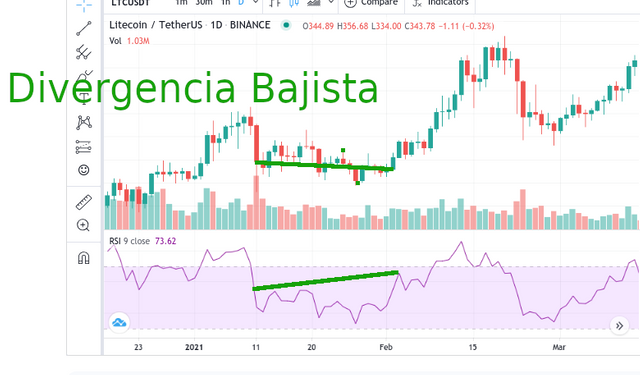
In order to filter these signals, it is necessary to know the divergences, whether they are bullish or bearish.
in upward divergences there is a tendency to rise while the price force relapses
To observe a downward divergence, the graph will indicate a downward trend and an increase due to the strength of prices
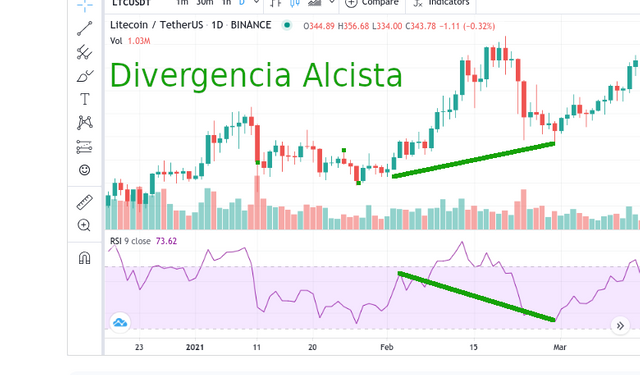
Bullish divergence
Check the chart of any pair (for example, TRX / USD) and present the various RSI signals. (Screenshot required)
No hay comentarios:
Publicar un comentario